1
2
3
4
5
6
7
8
9
10
11
12
13
14
15
16
17
18
19
20
21
22
23
24
25
26
27
28
29
30
31
32
33
34
35
36
37
38
39
40
41
42
43
44
45
46
47
48
49
50
51
52
53
54
55
56
57
58
59
60
61
62
63
64
65
66
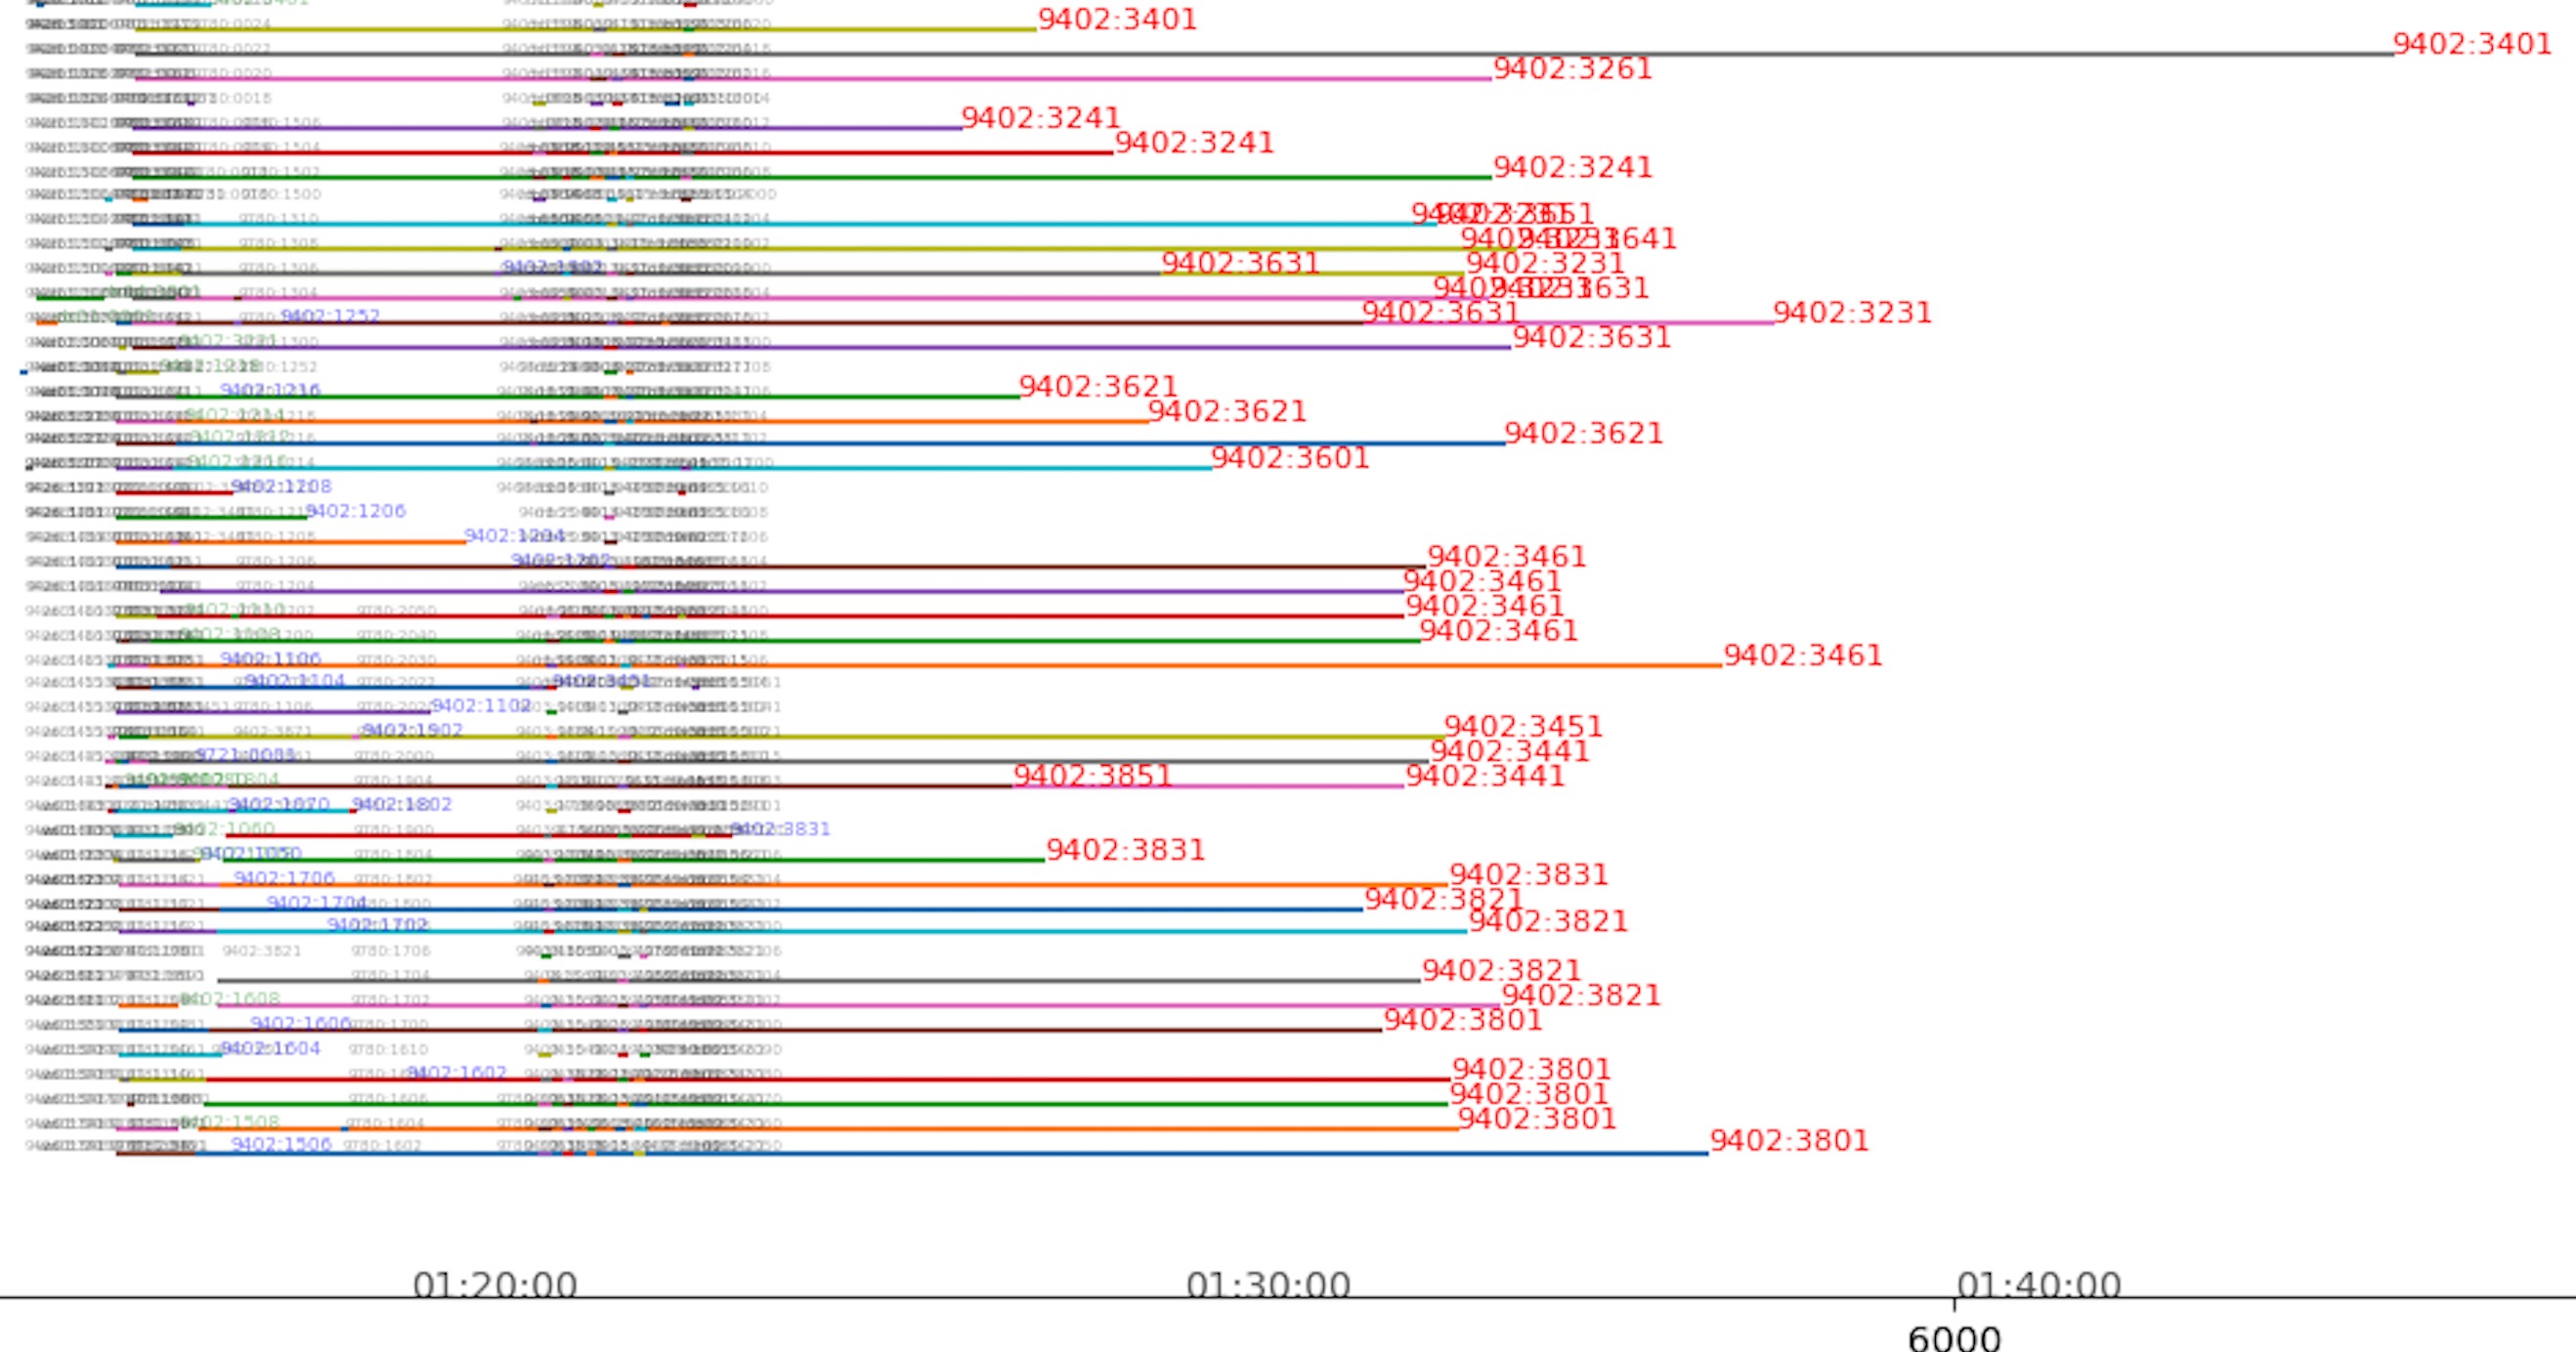
| import matplotlib.pyplot as plt
def draw():
f = open('log_file.txt', encoding='GBK')
i = 0
machid = 0
jiaoyms = []
fig = plt.gcf()
fig.set_size_inches(100, 15)
plt.xlabel('time')
plt.ylabel('process')
plt.title('batch stat - 20201118 - TimeLine')
mintime=1000000
maxtime=0
for line in f:
i += 1
machid += 1
if machid == 120:
machid = 1
starttime = int(line.split('|')[-6])
endtime = int(line.split('|')[-5])
if starttime > 220000:
continue
info1 = line.split('|')[5]
info2 = line.split('|')[8]
machine = line.split('|')[17][0:4]
startsecs = conv2Seconds(starttime)
endsecs = conv2Seconds(endtime)
if starttime < mintime:
mintime = starttime
if endtime > maxtime:
maxtime = endtime
plt.plot([startsecs, endsecs], [machid, machid])
if endsecs - startsecs < 10:
plt.text(endsecs, machid, info1+":"+info2, size=4, alpha=0.3)
elif endsecs - startsecs <60 :
plt.text(endsecs, machid, info1 + ":" + info2, size=5, color='green', alpha=0.4)
elif endsecs - startsecs < 600:
plt.text(endsecs, machid, info1 + ":" + info2, size=5, color='blue', alpha=0.5)
else:
plt.text(endsecs, machid, info1+":"+info2, size=8, color='red', alpha=1)
minsecs=conv2Seconds(mintime)
maxsecs=conv2Seconds(maxtime)
for i in range(minsecs, maxsecs):
if i % 600 == 0:
curTime = conv2NormalTime(i)
plt.text(i, -5, curTime, size=10, alpha=0.7)
plt.savefig("batch_analyze_result.png")
plt.show()
|
